PLUMBLINE TRADING SUITE Verify your edge. Hold it to the Plumbline.

The retail trader's path from idea to validated algo.

A free, open-source toolkit that catches overfit backtests before they cost you real money — with Monte Carlo, walk-forward, and permutation testing.


Four tools. One outcome.

Each stage solves a specific problem in going from trading idea to deployed algo. Together they form the pipeline: spec → validate → portfolio-fit → prop firm.


New here? Follow the workflow.

A 6-step pipeline from strategy idea to validated portfolio, with pass/fail gates at every stage. The full guide walks through each stage, the exact thresholds, and the decision logic.


Why this exists

Most retail backtests are overfit. A strategy that looks profitable across years of historical data often performs that way for one reason: it was tuned, by hand or by optimizer, to match the noise in the sample. When deployed forward, the edge disappears.

The statistical methods used by institutional quants to detect this — permutation testing, Monte Carlo resampling, walk-forward validation — are well-documented in the academic literature but rarely applied in retail workflows. The math is straightforward. The tooling was missing.

Plumbline Trading Suite is an attempt to close that gap. It is not a trading platform. It is not a signal service. It is a set of small, focused tools that answer one question: given the trades I observed, how confident should I be that the underlying strategy has a real edge?


How the validation works

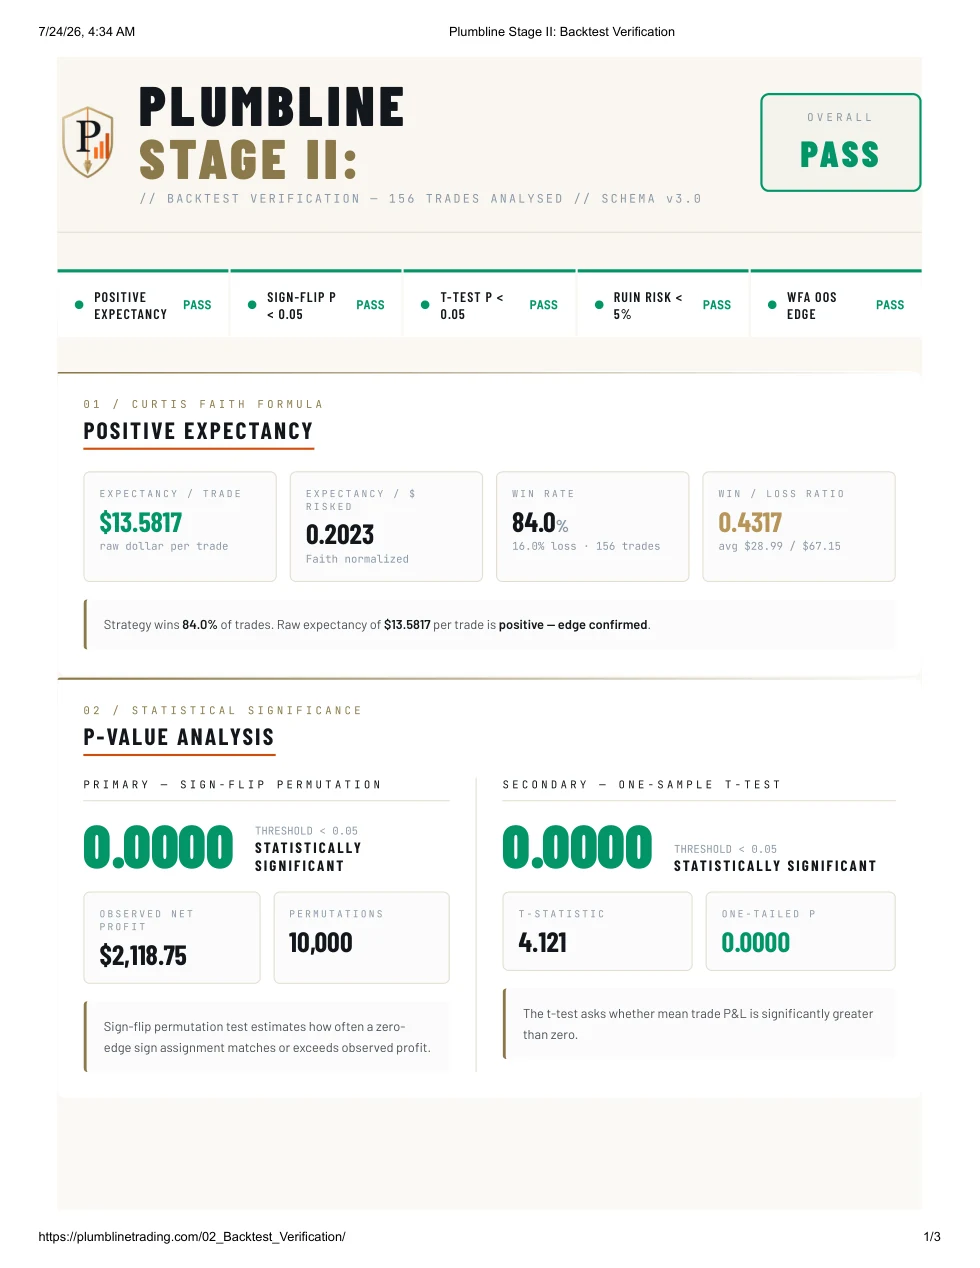
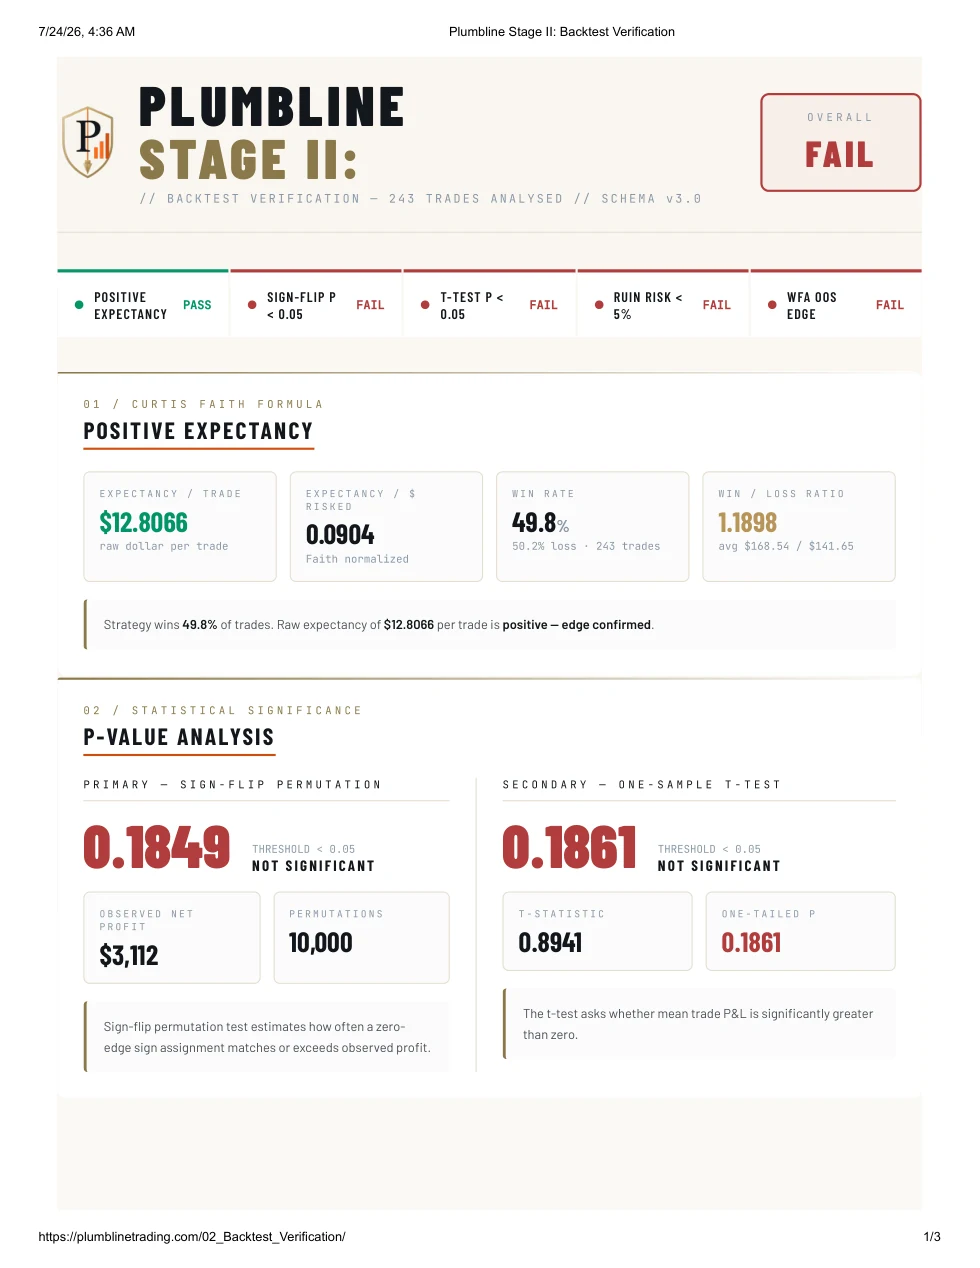
Plumbline Stage II: Backtest Verification applies three independent statistical tests. Passing one is not enough. A strategy that fails any of them is flagged for further investigation.

Sign-Flip Permutation

Randomly flips the sign of each trade's P&L thousands of times to estimate the distribution of outcomes under a null hypothesis of no edge. If the observed result is not significantly above the null distribution, the apparent edge may be noise.

Monte Carlo Bootstrap

Resamples the trade sequence with replacement to estimate the range of plausible equity curves and worst-case drawdowns. Reveals sequence risk and stress-tests the strategy against orderings that did not appear in the original backtest.

Walk-Forward Analysis

Splits the data into rolling in-sample and out-of-sample windows. A strategy that performs well in-sample but poorly out-of-sample is almost always overfit. The efficiency ratio between the two windows is the headline metric.

Further reading

  • López de Prado, M. (2018). Advances in Financial Machine Learning. Wiley.
  • Bailey, D. H., & López de Prado, M. (2014). The Deflated Sharpe Ratio: Correcting for Selection Bias, Backtest Overfitting, and Non-Normality. Journal of Portfolio Management.
  • Bailey, D. H., Borwein, J. M., López de Prado, M., & Zhu, Q. J. (2014). Pseudo-Mathematics and Financial Charlatanism. Notices of the AMS.

What the output looks like

A strategy with strong-looking surface metrics that fails statistical validation. The kind of result that is easy to miss when only watching win rate and profit factor.

plumbline-stage-ii · example.csv
Surface metrics
Total trades248
Win rate62.1%
Profit factor1.84
Net profit$4,210

Statistical validation
Sign-flip permutation p-value0.23
Monte Carlo probability of ruin18.4%
Walk-forward efficiency ratio0.31

FAIL. The observed result is not statistically distinguishable from chance (p > 0.05). Monte Carlo simulation shows an 18.4% probability of catastrophic drawdown under realistic trade reordering. Out-of-sample performance is 31% of in-sample — a signature of overfitting. Do not deploy.

What this toolkit does not do

Clarity matters more than marketing. These tools are useful for one specific thing. They are not a substitute for the other parts of a trading practice.


What is shipped, in progress, and planned

Honest accounting of the current state. The shipped tools are usable today. Everything else is work in progress, no guarantees on timing.